How Does it Work
In order to evaluate the effect of your spray program on the population of the pest, compared to an untreated population, you need to select a location and enter the list of applications you applied.
We DO NOT store your spray records on our servers. You can run multiple trials on a record if you edit it between runs and the results are ONLY temporarily saved on your browser for your convenience while using this tool. Any temporary data is automatically removed after few minutes.
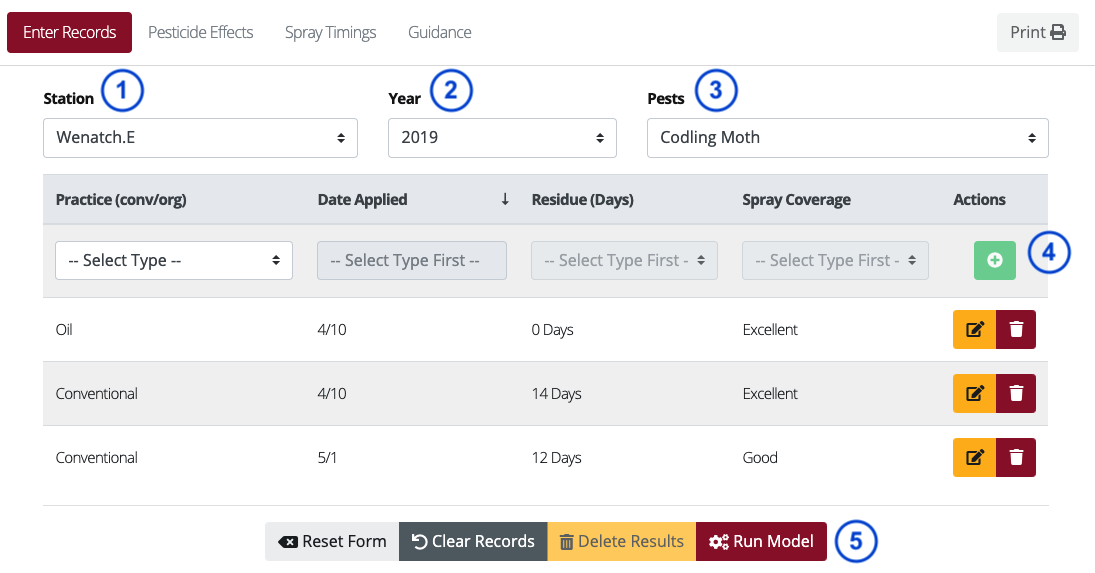
Input your data
- Choose the year of the spray program you would like to evaluate
- Select the weather station closest to the orchard you are considering
- Select the target pest of the spray program
-
Add your spray records. If you did a tank mix other than oil+pesticide, put in each
spray as if it
was applied separately. Each spray record will require:
- The date the material was actually applied.
- Which material was used (oil, conventional spray, entrust, or CM Granulosis Virus or Bt depending on the target pest).
-
The length of the residue period (5-17 days depending on material and target
pest).
We provide default values for conventional sprays that reflect industry norms for spray longevity and what sort of mortality occurs as well as some slight variations on them. For example, if you use a conventional pesticide, the residue default is 14 days, but you could choose values from 10-17 days. If the spray was an organic control of codling moth (e.g., virus), the residue is from 5-7. - The quality of that specific sprays coverage (poor, good, or excellent). The coverage value defines the mortality that the pest population experiences.
- Hit the "Run Model" button to generate the results
Read the results
The output produced by the tool gives you multiple pieces of information.
First it provides tables and
charts showing the efficacy of each spray of the program both individually and in combination with
the other sprays (and with or without Mating Disruption, if that applies to the selected pest). By
providing a breakdown of how each spray contributed to the program, the tool allows for each spray to
be evaluated as to how useful it was on its own and as a part of the overall control program.
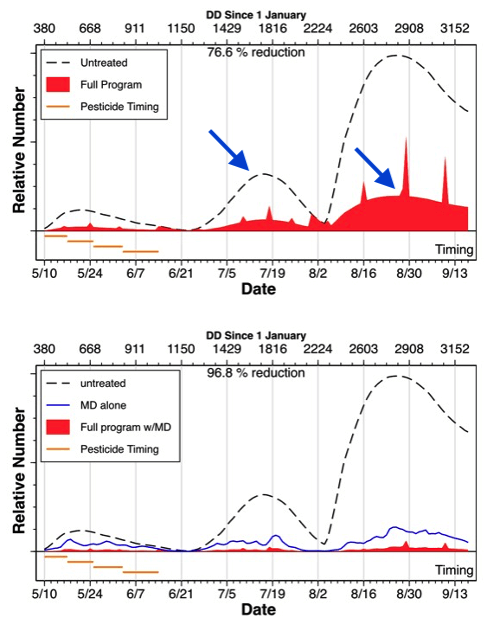
Additionally, figures are provided showing the suppression of the pest throughout the season.
For example, the chart below shows the surviving population (area in red) still present in the orchard
compared to the unmanaged control population (dashed line), in this case with and without Mating
Disruption (blue line) combination.
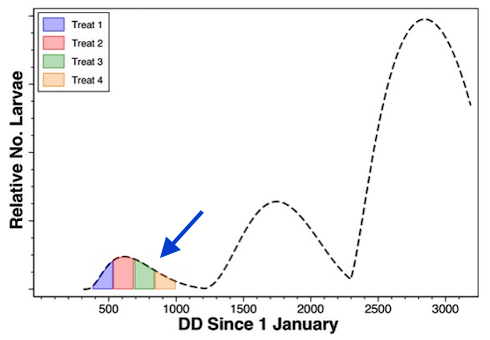
The second piece of the provided output is a chart which shows the timing of each spray relative to the pest development throughout the season. This allows you to understand which part of each generation was affected by each spray. This allows the grower to see if sprays overlapped (redundant) or if windows of control opportunity were missed. The important thing to remember when looking at this chart is that the reproductive adults that develop from missed control windows will contribute to the individuals mating and laying eggs in subsequent generations.
Lastly, for each pest, there is a guidance section that summarizes the best management practices for the optimal control of each of the six pests we have models for.
Still need help?
For further information about how to use this tool, interpret the results and learn how to optimize your
spray program in order to maximize its efficacy and reduce your pesticide costs, do not hesitate to
contact us!
We will be happy to chat with you or organize an workshop or set up an educational program for your
organization.